
Trend-setting measurement technology software
ProfiSignal 20 is the modern complete software for applications in the field of measurement data acquisition and analysis, visualisation and process control. With ProfiSignal 20 you can now visualise and analyse your measurement data platform-independently and monitor and control your processes without effort.
You can use the measurement software on the desktop PC in your office or on the measurement computer in the control center. Due to its future-oriented platform independence, ProfiSignal 20 can also be used on tablets and smartphones.
ProfiSignal 20 is modular, scalable and available in two versions:
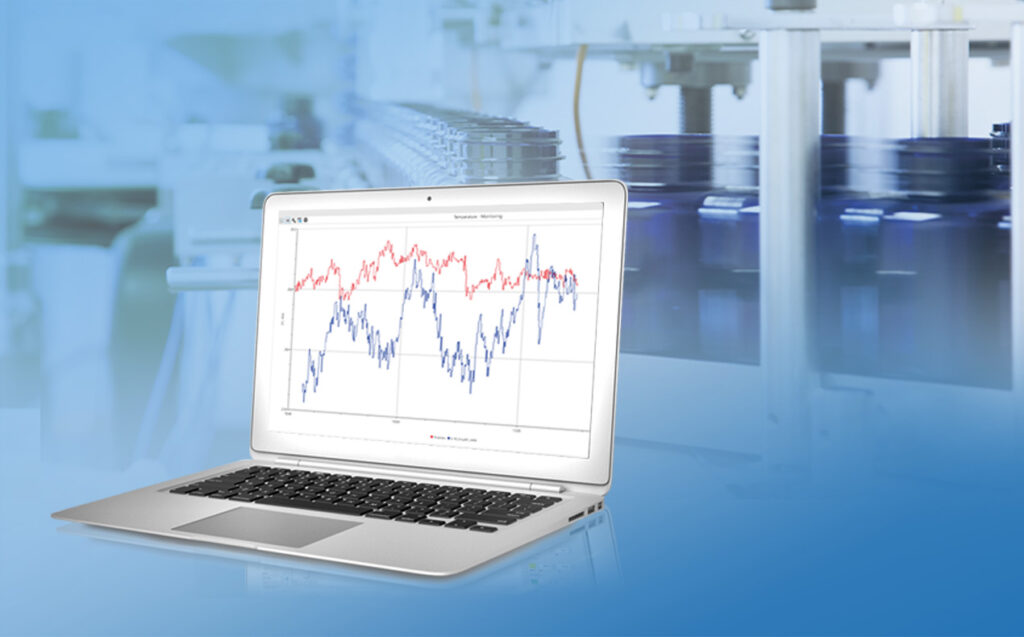
ProfiSignal 20 Go
The software takes you from measurement data to detailed graphical portrayals in just a few clicks.
More information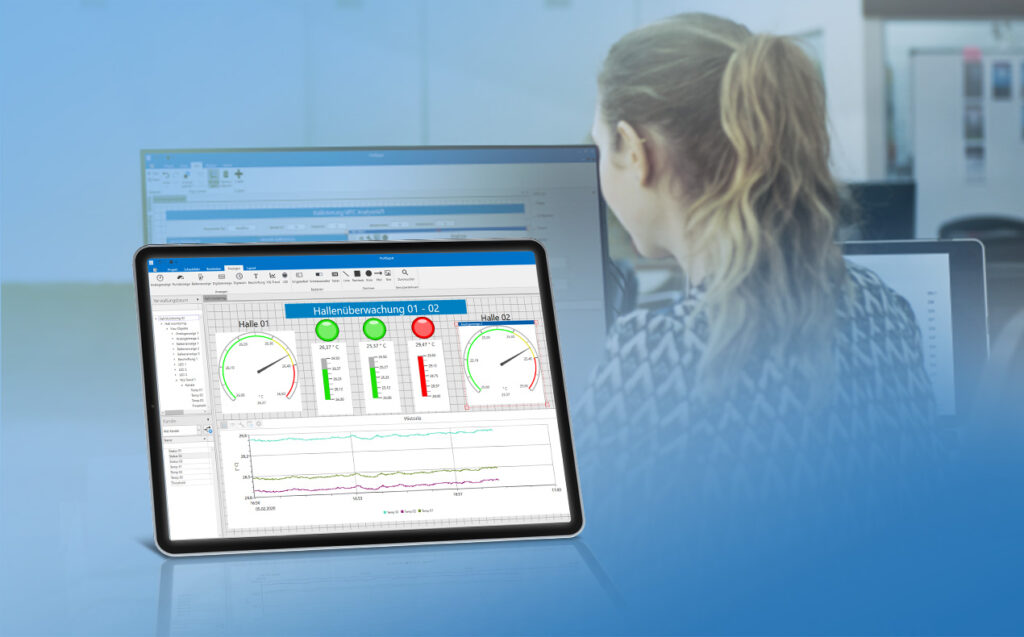
ProfiSignal 20 Basic
With the software you create sophisticated and detailed visualisations of installations and processes while also enabling easy process control.
More informationNew functions
New functions are constantly being added to our software. Here you will find a selection of the new software functions.
With the Push function you can receive a message on your smartphone or tablet as soon as an alarm occurs. This means you will never miss an alarm again and can act immediately to prevent any consequential damage to your machine or system. The sending of push messages can be configured individually. The alarms for which information is to be sent can be set individually for each user.
With the introduction of the new "Video" Visu object, you can now Video recordings and live streams directly into your visualization interface - for even more comprehensive process diagnostics and documentation.
The Visu object supports common video formats such as MP4, MOV, AVI and also allows the direct integration of live streams via HTTP or RTSP - from IP cameras, for example. Locally connected webcams can also be displayed in real time.
An additional feature is the new option, Save export configurations for ASCII data as a file. These export settings can be easily reused in other projects or diagrams. This function brings tangible efficiency benefits, especially for large volumes of data or standardized analysis processes.
ProfiSignal 20 now also enables the Individual setting of the time zone directly in the diagram - regardless of the system time or the original data source. With this function, you not only increase the comparability of your measurement data, but also avoid misunderstandings when analyzing time-critical processes.
With the Event function you can configure each object in ProfiSignal 20 Basic individually. By clicking on the Visu object, you can open web pages or other projects, display dialog boxes and adjust the properties of your Visu elements such as color, position, size, etc. This gives users of your project additional interaction options. This gives the users of your project additional interaction options.
With the Y(x) color diagram you enter the "third" dimension. You can now display the relationships between three measurement channels very easily - channel 1 provides the x-value, channel 2 the y-value and channel 3 the color for the respective data point. With the Y(x) color diagram, for example, dependencies of location and temperature can be displayed very clearly and relationships can be identified at a glance.
The Y(t) bar chart is a new variant of the Y(t) diagram. Measured values are not represented here by points, but by bars that extend vertically from the x-axis to the respective measuring point. This type of representation is particularly suitable when the development of the absolute value of a measured variable over time needs to be visible at a glance.
The Time-independent bar chart allows you to display the last incoming measured values for each channel in bar form. The display is independent of time. You can set the number of the last x measured values to be displayed.
You now have the option of using the Y(t) diagrams, Comments and so-called "Markers" with which you can mark and describe important measuring points. A special feature is that these markers can also be saved in the associated measurement files and reappear when they are reopened. This makes your work much easier during analysis.
In the Alarm table you can display all pending and acknowledged alarms clearly at a glance. The alarms and alarm classes can be configured in the DataService or Delphin Data Center without any programming effort.
Do you need or want to document your measurement results in a meaningful way? Then the extended Diagram print function the right tool for you! With this function, you can customize your printouts including diagram area, legend and comments exactly to your individual requirements and print them out on any connected printer or save them in pdf format.
The added Visu object "Chart navigation" makes it easy to switch back and forth between different dashboards of a project and thus significantly simplifies the operation of larger projects.
The Sequencer is a powerful tool for automating your test sequences. You can create any number of target value curves and run them automatically. You also have the option of using loops to run through sequences several times and to pause sequences until target values have been set. This allows you to implement your individual application without any programming effort, for example for burn-in tests or other quality tests of your products.
Product highlights
- Fully platform independent - optimised for desktop PCs, laptops, tablets and smartphones
- Graphical portrayals for a wide range of applications
- Powerful measurement data portrayals with instant and smooth transition between live and historical data
- SCACH function - one scan is sufficient to open the machine and plant-specific measurement data and visualisations
- Windows, Android and IOS operating system support
- Modern interfaces and operating designs - adapted to the look and feel of the relevant platform
- Beginner and expert modes to match individual needs
Perfect operation on all levels
ProfiSignal 20 maps the structures completely. From the production hall overview to each individual machine or plant. From the test laboratory to the respective test stand. It could not be easier or more transparent. If you use your mobile devices, no matter where you are, with ProfSignal 20 you can check the current operating parameters of individual plant sections or machines.
The highlight of ProfiSignal 20 is its complete platform independence - the same project is available on any end devices, each optimized with regard to the display and operating concept of the respective platform. No matter where and how you want to access your processes - ProfiSignal 20 offers the optimal solution for all applications.
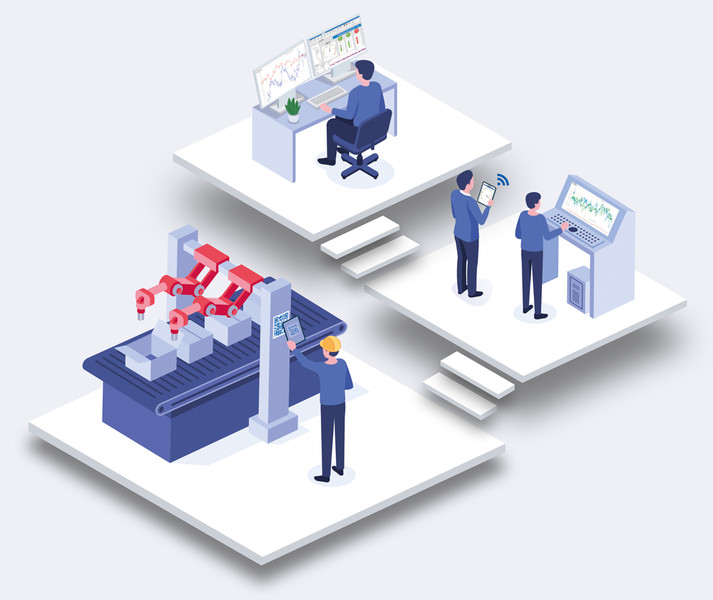
Thanks to the new SCACH function, you only need to scan an individual QR code attached to each machine with the camera of your smartphone or tablet, and a single measurement diagram or even the complete plant visualisation appears on your mobile device. In this way, you only have to run to the parts of the machine whose measured values you are currently interested in and the relevant data can be displayed without any effort. You can also use the same ProfiSignal 20 project to display the data on your desktop PC.
You can find the system requirements for our software products here.
Suitable measuring and testing devices


Modular data acquisition
Precise adaptation to the application thanks to various I/0 modules | Expandability possible with additional modules and slave devices | Durability thanks to the use of high-quality components and parts | Cost efficiency thanks to modularity
To the product
Modern vibration specialist
Precise monitoring to detect potential failures at an early stage | Cost reduction through optimization of maintenance intervals | Increased machine availability and reduction of downtimes, for more productivity and efficiency | Quality improvements through data analysis and optimization of processes
To the product
Compact data logger
Universal small-channel data logger for industrial use | Cost-effective setup of decentralized measurement networks without channel overhead | High reliability and durability thanks to industrial-grade components | Avoidance of ground loops thanks to galvanic isolation and differential inputs
To the product
Mobile measurement data laboratory
Easy and space-saving laboratory measurements | Plug-and-play - ready for immediate use without complex set-up | High-resolution acquisition of measurement signals for laboratory and training | Intuitive operation, simple visualization and analysis with measurement technology software
To the product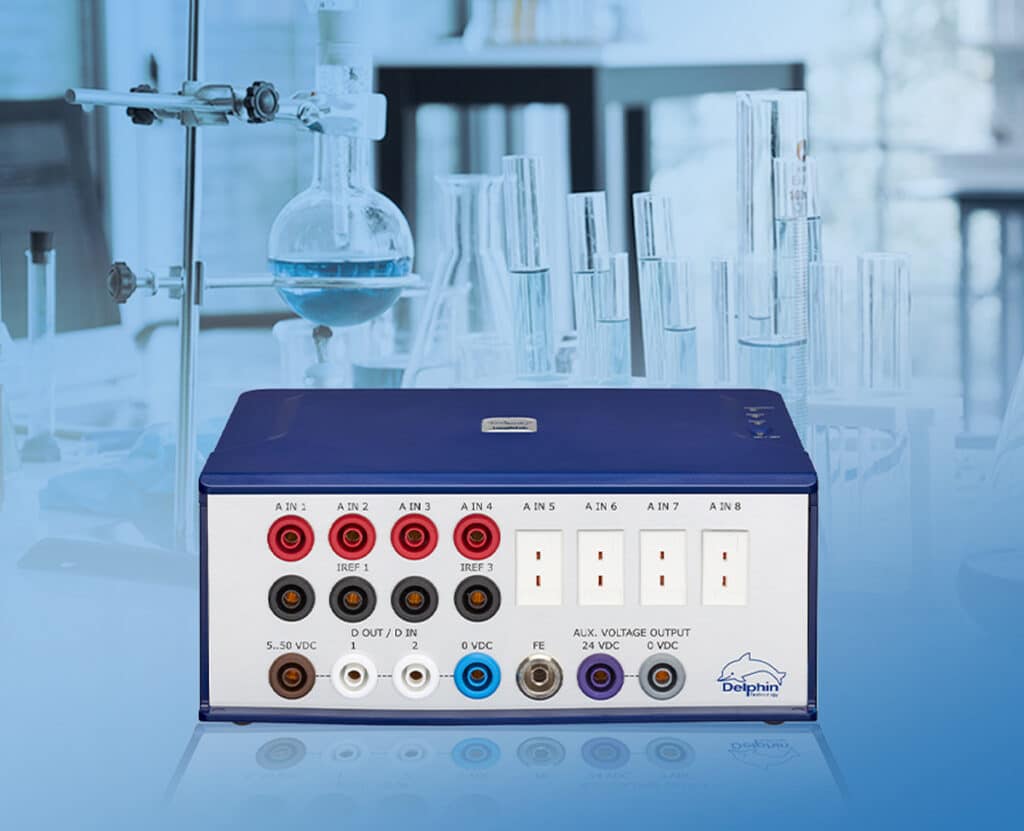
Universal data acquisition
Simultaneously record and analyze various measured variables | Flexible adaptation to different requirements | Continuous process monitoring to detect deviations | Increase plant availability and efficiency system availability and increased efficiency
To the product
Modular measurement and control technology
Adapts modularly to measurement and automation tasks | Regulates and controls processes directly - without additional hardware | Maintenance-free continuous operation in industry and laboratories | Seamless integration into existing systems and networks
To the product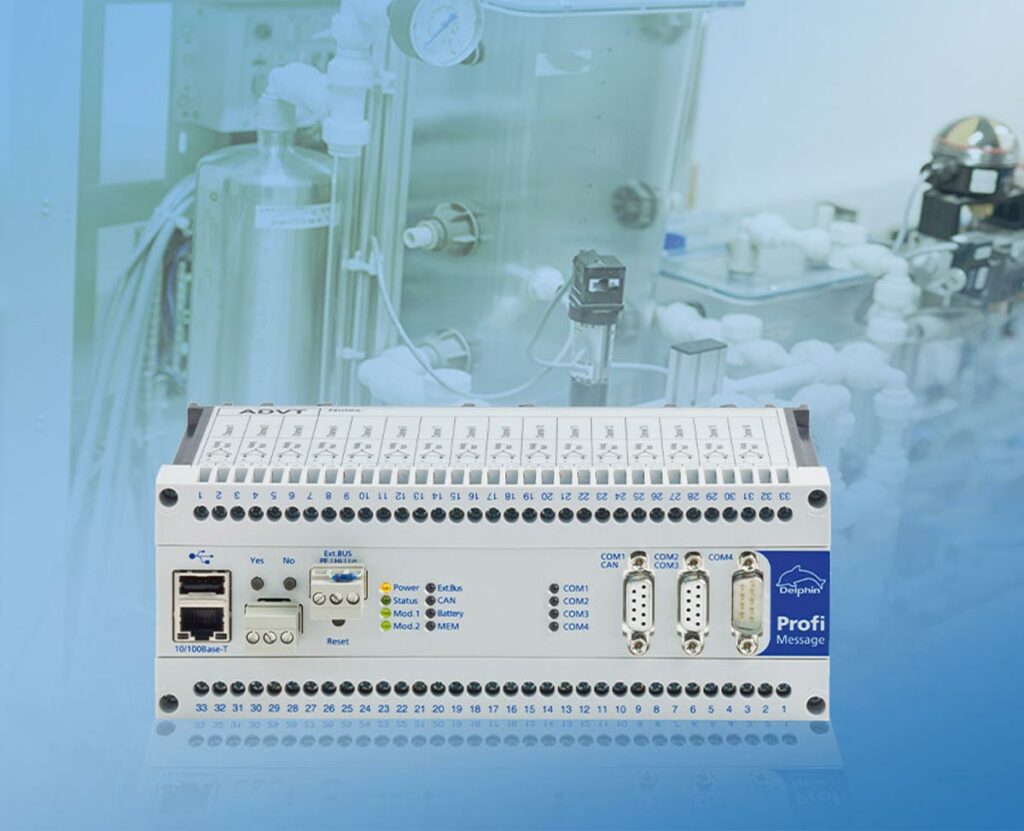
Synchronous fault specialist
Recording and evaluation of transient signals over a certain period of time | Autonomous operation with long-term memory | Low energy consumption ensures cost-effective operation
To the product